Fall 2019 CS109A Final Project, Group 108
ExploreWe live in a digital world that is ever-changing, from the sources of our information, to the credibility we place in various online mediums, and the ease and patterns of disseminating information. Online text is incredibly powerful. Furthermore, social media is ubiquitous, and Twitter alone produces, on average, 500 million tweets a day. Individual tweets can have profound a effect.
Another global trend is that the political landscape is becoming increasingly polarizing. Within the United States, we are experiencing a unique period in history. To this end, tweets, especially political ones, are influential and ripe for analysis. Throughout the past four years, President Donald Trump has often tweeted about both market related and nonrelated topics. We are seeking to discover a relationship between intraday CBOE Volatility Index (VIX)/S&P 500 data and President Trump's tweets from January 2016 to November 2019.
Of course, there has been extensive research into this topic, and many different studies have attempted to discover a correlation between President Trump's tweets and market data. Studies have probed Trump's tweets for connection with volatility and price of stocks, bonds, and all the options in between. Both short and long term effects have been studied widely.
Although many studies on the topic exist, each differs a bit in methodology and subject matter. Regarding President Trump's tweets, everything from the frequency of his tweets to sentiment analysis of his words has been examined. What unites these differing studies is the focus they take–be it predicting the performance of individual companies after company-specific tweets by President Trump or predicting the performance of the US Foreign Exchange market based on the president's tweets, a lot of research takes a close look at a specific subset of tweets or areas of prediction. In the former example, the study was able to determine that company-specific tweets caused fluctuations in stock value, focusing specifically on anecdotal evidence based on fluctuations in Toyota and Nordstrom stock and corresponding Trump tweets about the companies. There was also evidence that the effect of his tweets was greater prior to his inauguration in January 2017. Most interestingly, however, the researchers found that although there was impact on millions of dollars of shareholder value, the spike or drop in value would generally return to prior status quo after about 24 hours (Ref. 1). This was somewhat mirrored in the study on Trump's tweet effects on US Financial Markets and Foreign Exchange value. This study also found, through a sentiment analysis of the president's words, that although there can be short term effects and fluctuations on benchmarks such as the US-Canadian currency exchange rate, such fluctuations do not persist, and other bilateral exchange rates were not significantly affected. There did seem to be lasting effect on the US Dollar Composite Exchange Rate–a first in the many studies related to tweets' effects on the market (Ref. 2).
Studies focusing on wide-range market fluctuation based on an aggregate of all Trump's tweets yield varied responses, most of which indicate a lack of a relationship. Tong Yang and Yuxin Yang, using NLP and LSTM Networks, were able to out-predict their benchmark of 40% with a 48% 3-class classification accuracy, but concluded that there is not quite a sufficient relationship to make deterministic predictions (Ref. 3). Our goal is to follow this type of processing (NLP processing of all tweets, followed by constructing various models and choosing the best performing one) in order to determine for ourselves whether or not S&P and VIX fluctuations can be predicted following President Trump's tweets. We may also take a look at specifically predictive words, as JP Morgan Chase found that "according to the analysts, Trump tweets using the words “China,” “billion,” “products,” “democrats,” and “great” were the biggest market movers" in their creation of the Volfefe index (Ref. 4).
We pulled President Trump's tweets from the Trump Twitter Archive. The original data we pulled included tweets put out between January 2016 and November 2019. Although we initially pulled with retweets, during our data cleaning and exploratory data analysis, we decided to not use the retweets as part of our model, as they did not reflect President Trump's original words. From the data pulled we were able to ascertain tweet content (text), source, time created, number of retweets, number of favorites, date, and time stamp.
For market data, we obtained intraday minute S&P 500 as well as VIX data from CS109A Teaching Staff via Harvard Business School, Baker Library Databases, Bloomberg Databases and CS109A Final Project Group 3 respectively (Ref. 5), (Ref. 6). The intraday S&P and VIX data are numerical, while the dataset containing Trump’s tweets has both textual data (in the form of the text of his tweets), and numerical data for the number of likes and retweets per tweet. Each data point in all three datasets is marked with a timestamp (date and minute); for the intraday S&P 500 dataset, each row contains open, high, low, close, volume, and tick count of the index from 0:00 to 16:00 for business days between 11/13/2016 to 11/08/2019, and for the intraday VIX dataset each row contains the volatility index from 3:15 to 16:14 for business days between 12/01/2015 to 11/11/2019. Finally, for the Trump tweets dataset, each tweet is marked with the date and time the tweet was posted.
Some challenges we had included processing text data, since there are many ways of going about generating features from text data. The way in which we did it (TFIDF) generated around 10,000 features, which resuslted in difficulties in training. Additionally, we ran into difficulties reconciling data sets at the 1 minute and 5 minute levels. Lastly, we initially struggled to really improve the model, for we tried many different models but the accuracy varied greatly depending on the length of prediction, and the runtimes of our models led to difficulties in tuning the parameters exhaustively.
We cleaned the text data in the Trump Tweets dataset by removing all non alpha-numeric characters and English stop words, as well as standardizing case, using a function (string_manipulation) developed for a project in a kaggle competition.
Because Trump tweets on non-business days, we standardized the dates across both the intraday S&P 500 dataset and the Trump Tweets dataset by dropping rows in the Trump Tweets dataset that did not correspond to a business day on which intraday S&P 500 index metrics were calculated, and then dropped rows in our S&P 500 dataset whose associated dates did not correspond with the remaining Trump Tweets dataset. We carried out this identical procedure to reconcile dates between the intraday VIX dataset and the Trump Tweets dataset.
In order to understand the immediate impact of Trump’s tweets on market volatility, we linked S&P 500 index metrics and Trump’s tweets, as well as VIX data and Trump’s tweets at the minute level using datetime objects, resulting in two datasets. One dataset contains each Trump tweet matched with the S&P 500 index metrics corresponding to the exact time and date the tweet was posted, and another contains each tweet matched with the VIX metric corresponding to the exact minute and date Trump published the tweet.
Finally, we created a function (get_perc_change_after_time (for the S&P dataset), get_perc_change_after_time_vix (for the VIX dataset)) that calculates the percent change between the S&P 500 / VIX index metric the minute Trump posted the tweet and a user designated number of minutes after the tweet was published so we can understand the impact of Trump’s tweets on market volatility at various timeframes after posting.
Our data exploration was made up of three different stages: exploring the S&P data and VIX data, exploring the tweet data, and exploring the interactions and relationships between the two combinations of datasets (Trump tweets and S&P, Trump tweets and VIX).
We also explored the text data of Trump’s tweets, examining the most frequent words and building a Word2Vec model that allows us to see the degree to which words are associated with one another in Trump’s tweets.
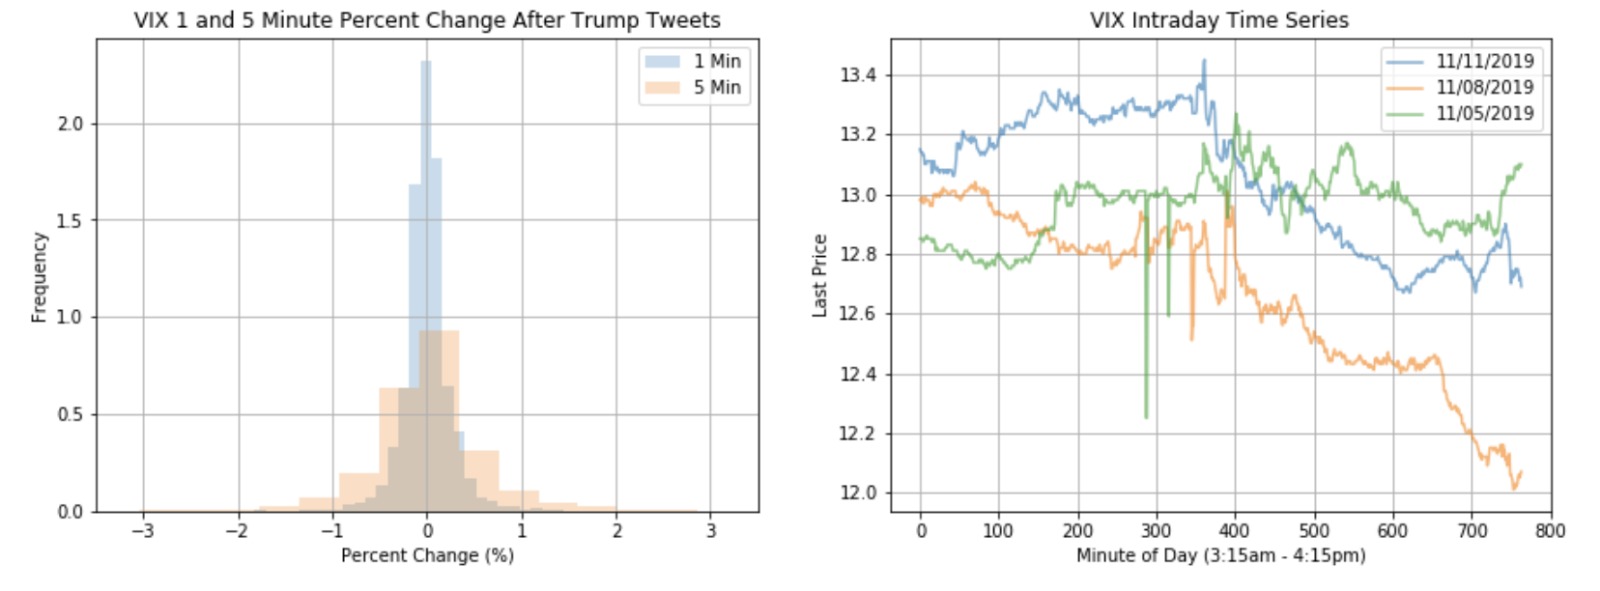
The distribution of percent changes has a bell-shaped distribution that seems to be somewhat more heavy-tailed than a normal distribution, especially for 5 minutes post-tweet, which also has greater variance (this can be investigated further). We randomly chose 3 days to demonstrate the microfluctuations throughout 24 hours that could be impacted by the President's tweets, since we felt that interday data did not show this. The intraday time series shows microfluctuations throughout the day, with 11/11 and 11/08 demonstrating a downward trend throughout the day and 11/05 ending with an upward tick.
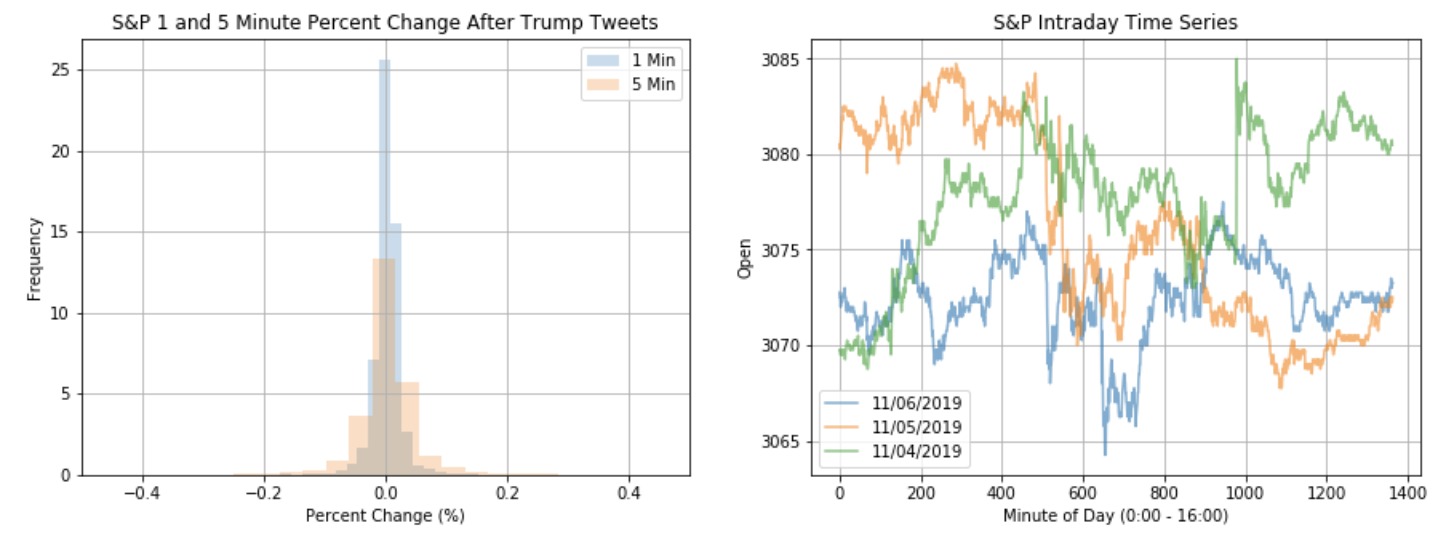
The distribution of percent changes has a bell-shaped distribution. The percent change at the 5-minute level seems to have greater variance. We randomly chose 3 days to demonstrate the microfluctuations throughout 24 hours that could be impacted by the President's tweets, since we felt that interday data did not show this. The intraday time series shows microfluctuations throughout the day, with 11/06 ending neutrally, 11/05 ending in the negative, and 11/04 ending with positive changes.
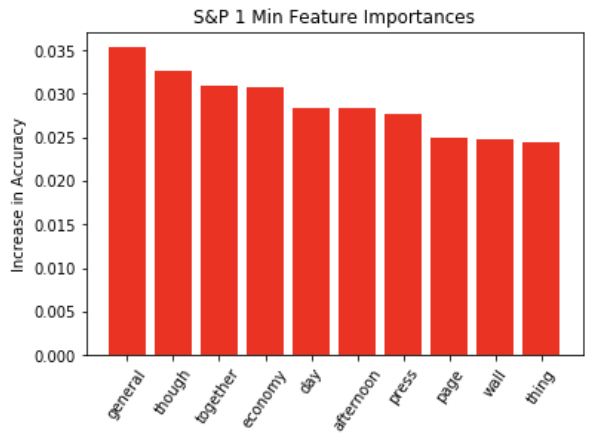
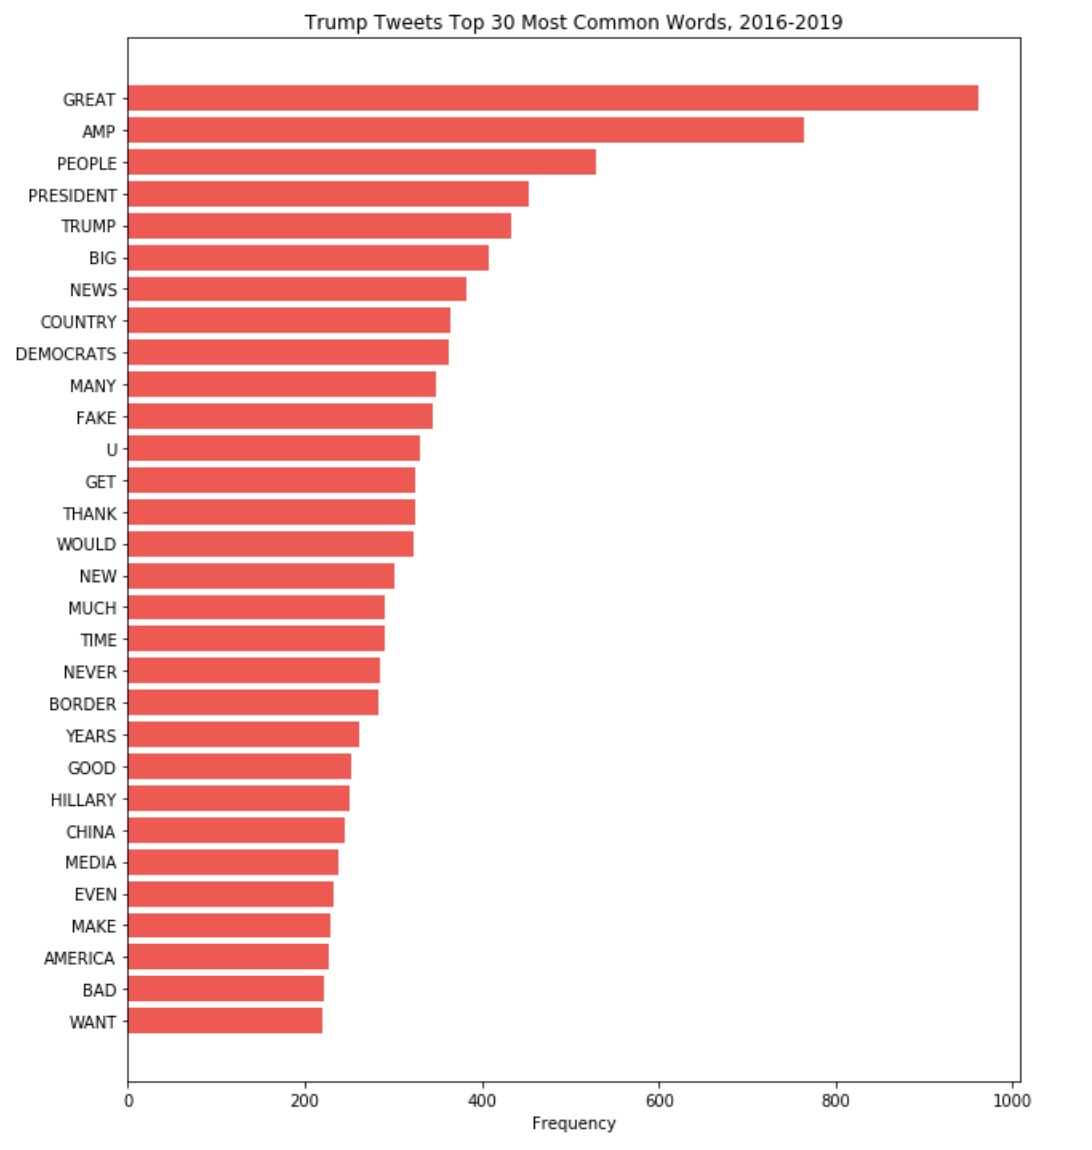
The bar graph on the left shows the most common words that have appeared in President Trump’s tweets from 2016-2019. Some of them, such as “great” and “big”, could be helpful in indicating sentiment of tweets. “Amp” corresponds to ampersand, which is not so important in this analysis. Other words are highly political—”democrats” and “Hillary”. In general, it seems that individual words have more political face value, rather than economic correspondence, so it will be interesting to see how they match up to tweets that impact the market down the line.
The cleaned text data in President Trump’s tweets ranged from only 1 character to over 200 characters that are close to the Twitter character limit. The distribution of the number of characters of his tweets after cleaning the text shows a distinction between the two types of tweets: concise tweets with a small number of words that say things like ‘READ THE TRANSCRIPT!” and longer tweets that are closer to the Twitter character limit, which usually contain more thorough messages than the shorter tweets. There are not many tweets in the 25-75 characters range, the 100 to 150 characters range, and the 175-225 characters range. This trend may become helpful for modeling.
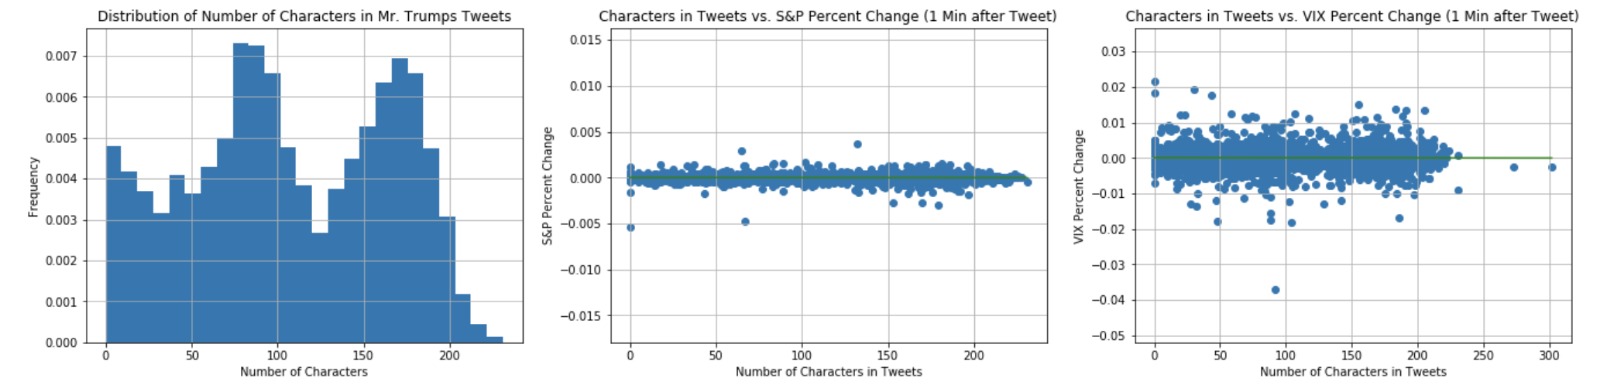
The above scatterplot shows there is no relationship between length of tweet and VIX/S&P 500 percent change one minute after President Trump tweets, and thus the relationship is probably in the text or content of his tweets.
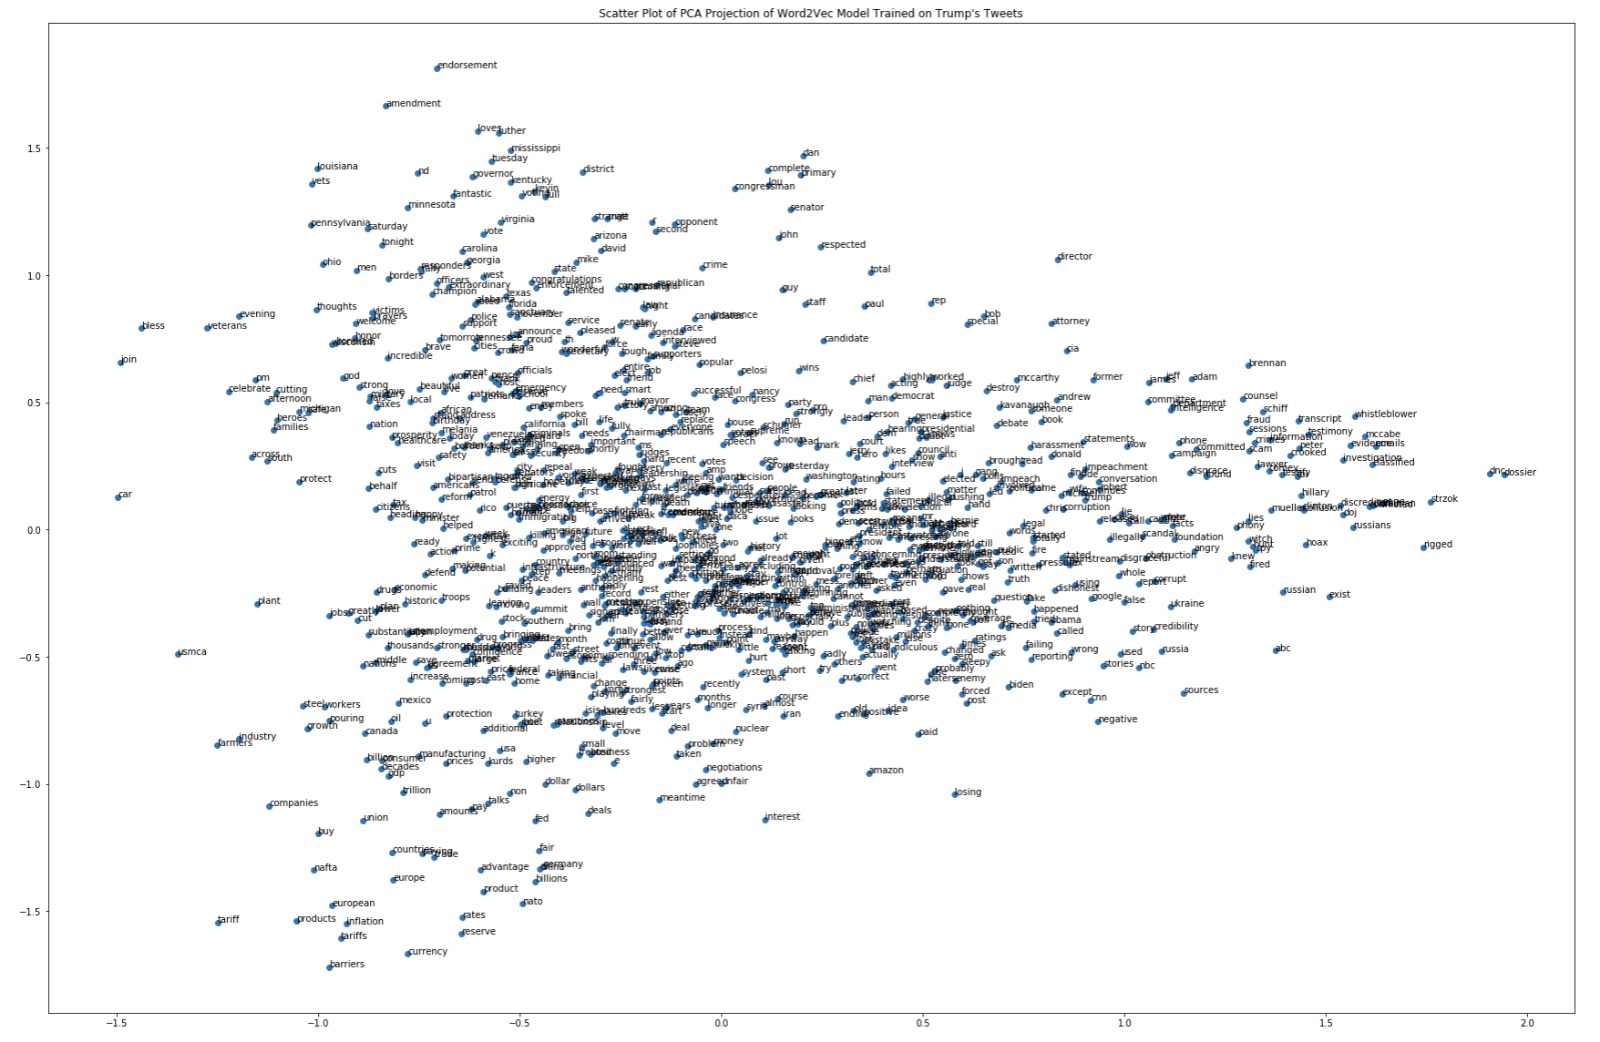
From this word vector plot we can see a number of words in the bottom left of the plot that relate to the economy. These relationships can be potentially explored in our models.
We changed our models and the plans for them significantly throughout the course of the project. In the beginning, we were looking to analyze daily bond yield data, but after acquiring minute data for the S&P 500 and CBOE Volatility Index (VIX), we decided it would be a more vigorous inspection of fluctuations the President's tweets might cause. From our review of literature we saw that the President's tweets could have a stronger effect on short-term market metrics. At first, it was difficult to move prediction accuracies past average model performance, so we used cross-validation and played around with regularization and tested different models, as well as different time frames, to see what would yield the best results.
We used a logistic regression model as our baseline model fitted on S&P and VIX data at 1 and 5 minutes intervals after Trump tweets (resulting in four different baseline models). We selected the most optimal regularization parameters for our baseline logistic regression models through cross validation. For three out of the four of our baseline models (1 Minute S&P, 5 Minute S&P, and 5 Minute VIX), we achieved a classification accuracy of around 50% on the test set, which is no improvement above average or a classification model that outputs all 1s or all 0s, as we had resampled our test data to have 50% 1s and 50% 0s. For our logistic regression model trained on the intersection of Trump Tweets and 1 Minute VIX data, we were able to get around 10% above average with an accuracy of ~60% on the test set.
Because our regularized logistic regression models for predicting the impact of Trump’s tweets on S&P 500 returns at the 1-minute and 5-minute levels did not have a high accuracy on the test set, we turned to ensemble/decision tree models such as Random Forest, AdaBoost, and XGBoost, as well as a Neural Network to see if we can achieve a higher classification accuracy above the benchmarks set by the baseline logistic regression models. For all four models, we searched for optimal parameters using cross-validation and grid search. The accuracy of each model on the validation set with respect to various parameters are plotted below. For our final models, we chose the combination of parameters that allowed for the highest classification accuracy on the validation set.
We then used these models to predict a two-class classification of the S&P moving either up or down/staying constant 1 minute after President Trump sends out a tweet. XGBoost performed best with a 61% accuracy on the test set.
We then used these models to predict a two-class classification of the S&P moving either up or down/staying constant 5 minutes after President Trump sends out a tweet. XGBoost performed the best with an accuracy of around 56% on the test set.
Because our regularized logistic regression models for predicting the impact of Trump’s tweets on VIX metrics at the 1-minute and 5-minute levels did not have a high accuracy on the test set, we turned to ensemble/decision tree models such as Random Forest, AdaBoost, and XGBoost, as well as a Neural Network to see if we can achieve a higher classification accuracy above the benchmarks set by the baseline logistic regression models. For all four models, we searched for optimal parameters using cross-validation and grid search. The accuracy of each model on the validation set with respect to various parameters are plotted below. For our final models, we chose the combination of parameters that allowed for the highest classification accuracy on the validation set.
We then used these models to predict a two-class classification of VIX moving either up or down/staying constant 1 minute after President Trump sends out a tweet. Random Forest performed the best with an accuracy of around 94% on the test set.
We then used these models to predict a two-class classification of VIX moving either up or down/staying constant 5 minutes after President Trump sends out a tweet. XGBoost performed the best with an accuracy of around 80% on the test set.
We built Random Forest regression models to predict the amount that the S&P or VIX went up or down 1 or 5 minutes after President Trump sent out a tweet. We compared the mean squared error (MSE) of the Random Forest regression model against that of a trivial model (Baseline) that predicts all 1s or all 0s. We found that all four of the regression models did not perform better than the baseline in terms of MSE.
The S&P500 data are not easily predictable with a regression model on a 1 minute prediction period.
The S&P500 data are not easily predictable with a regression model on a 5 minute prediction period.
The VIX data are not predictable with a regression on a 1 minute prediction period.
The VIX data are not predictable with a regression on a 5 minute prediction period.
Our models reached our goals in that they surpassed the baseline models' classification accuracy, especially XGBoost and Neural Net for VIX 1-minute post tweet (0.94, 0.70, respectively), and XGBoost for VIX 5-minute post tweet (0.80). The prediction models for S&P data were still fairly successful, with XGBoost again outperforming other models at 0.61 for 1 minute post-tweet and 0.56 for 5-minutes post tweet. We suspect that the predictions for VIX were stronger as a result of the nature of the VIX data. Since VIX is an index of volatility, it could naturally be more deeply and immediately affected by the president's tweets. As VIX is a measure of future change as implied by S&P 500 index options (derivatives from the stocks in the S&P 500, including volatility, securities, exotics, etc.), one can think of it as a predictive measure of the rate of change of the S&P 500 index, and it could logically be understood that a tweet might alter futures' implied volatility for a moment without actually moving the S&P 500. From a quantitative standpoint, VIX data has a greater variance, a quality that could also explain the greater predictive accuracy we were able to achieve.
In building our models, we looked at both VIX and S&P 500 data to diversify the potential findings and varied our predictions based on 1 minute and 5 minute time intervals, in case one time interval allowed for more predictive power in our models. Overall, the data was very noisy and difficult to predict, and none of the models were able to predict well for the S&P data. The average prediction accuracy is 50% if the model classifies on a two-class base (1 or 0), since we resampled the test data to have 1 as the response variable 50% of the time and 0 as the response variables 50% of the time. All of our final "best" models were able to predict above average. In most cases, XGBoost outperformed other models by quite a large margin, but in the case of 1 minute post-tweet VIX data, Random Forest was able to predict with a 94% accuracy.
In general, because it is so difficult to predict fluctuations across different datasets, and because the best predicted interval is 1 minute, there seems to be weak if any connection between Trump’s tweets and consistent variations in the market. Based on our models and previous literature, it is clear that although there may be momentary fluctuations, long term effects and market value are not deeply impacted by the President’s tweets. Our models and the relationship explored, however, may be useful in certain cases, such as when trading options volatility.
It would be helpful to run our models on more datasets, including but not limited to the DJIA or US Foreign Exchange rate statistics. This might help generalize a model and give a better idea of whether or not there is a real, predictable relationship. Along with looking at keywords, we can try to vectorize the distances between words in Trump's tweets with a selected subset of economy-related words as ascertained by past studies, such as "China", "billions", or "great". Or, rather than generalizing, we might look to narrow the scope of study, and only look at the President’s tweets that contain a specific set of keywords, so we might be able to see whether market-related or economy-related tweets could affect the market. Ultimately, due to the limited scope of this project and the vast array of data available, there are a lot of adjustments that could be made to our study in order to get a better sense of the relationship between the President’s tweets and the US Market.